According to the EPA.gov website, The United States Environmental Protection Agency (EPA) develops an annual report titled the Inventory of U.S. Greenhouse Gas Emissions and Sinks (Inventory), that tracks U.S. greenhouse gas emissions and sinks by source, economic sector, and greenhouse gas going back to 1990. The EPA publishes the draft report in February to allow for public comment prior to publishing the final report by April 15 of every year. The EPA has prepared the Inventory of U.S. Greenhouse Gas Emissions and Sinks since the early 1990s. This annual report provides a comprehensive accounting of total greenhouse gas emissions for all man-made sources in the United States. The gases covered by the Inventory include carbon dioxide, methane, nitrous oxide, hydrofluorocarbons, perfluorocarbons, sulfur hexafluoride, and nitrogen trifluoride. The Inventory also calculates carbon dioxide emissions that are removed from the atmosphere by “sinks,” e.g., through the uptake of carbon and storage in forests, vegetation, and soils.
Key findings from the 1990-2016 U.S. Inventory include:
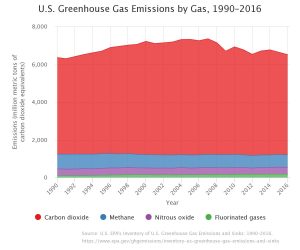
- In 2016, U.S. greenhouse gas emissions totaled 6,511 million metric tons of carbon dioxide equivalents, or 5,795 million metric tons of carbon dioxide equivalents after accounting for sequestration from the land sector.
- Emissions decreased from 2015 to 2016 by 2.5 percent (after accounting for sequestration from the land sector). This decrease was largely driven by a decrease in emissions from fossil fuel combustion, which was a result of multiple factors including substitution from coal to natural gas consumption in the electric power sector, and warmer winter conditions that reduced demand for heating fuel in the residential and commercial sectors.
- Greenhouse gas emissions in 2016 (after accounting for sequestration from the land sector) were 12 percent below 2005 levels.
- To view the full report visit https://www.epa.gov/sites/production/files/2018-01/documents/2018_complete_report.pdf