by Richard Harshaw
In my last column, I made a passing reference to a “departmentalized income statement” and promised I’d get back to that topic soon.
Promise made, Promise kept!
What Do I Mean by “Departmentalized”?
First, I assume you know what an income statement is. (Some call it a profit and loss statement, but that is impossible—it cannot be, at the same time, a profit AND a loss statement. It is one or the other!) If you don’t know what in income statement is, I can only wonder how you have made it this far (unless this is your first week in the trade).
By “departmentalized”, I mean in income statement that is broken up into your respective “profit centers” (what most contractors call “departments”) so one can see quickly which departments are doing great (those favorite children you will feed and nurture) and which ones stink (those kids who you swear aren’t yours and who you’d like to starve out of existence).
It is easy to do, but the trouble is, most off-the-shelf accounting packages don’t do it the right way. And doing it the wrong way may make it possible for those ugly kids you swear aren’t yours to inherit your wealth. But I digress.
Don’t Panic—There’s an App for That!
Well, not actually an App, but at least a spreadsheet. At the end of this column, I’ll tell you how to get a free copy.
Start by listing all your departments. This list might look like this for you:
Installation
Service
Or, if you are a little more complex, like this:
Residential Installation
Commercial Installation
Service
Plumbing
Refrigeration
It can get complex—residential and commercial NEW construction, residential and commercial REPLACEMENT construction, residential and commercial service, plumbing, sheet metal, refrigeration, electrical, and so on.
But here is my rule of thumb: don’t list more than 7 departments. (If each department was an equal contributor, each would contribute about 14% of your revenues, and measuring below that level is often an exercise in frustration.)
Assign to Each Department What You Can
For each department, it is now vital that you attribute revenues and expenses. [1] You will need to list revenues for each of your departments, obviously. [2] But also it is a requirement that you track the cost of direct labor to each department. You must get this from your payroll records and be sure to include the cost of benefits as well as all unbillable time.
[3] Next, be sure to track the cost of goods sold (material costs) for each department. (This includes, of course, condensing units, heat pumps, furnaces, coil, air handlers, controls, boilers, and so on.) For the service department(s), list the cost of parts that were sold.
[4] Next, you’ll need the total overhead from your income statement. That’s all you need to get a rough departmentalized picture.
Don’t Get Lost in the Weeds
Some contractors go well beyond these general guidelines, but these are adequate to help you develop the proper factors for job pricing (using COWL). Some contractors, for example, track individual trucks to individual departments—but what happens if on Thursday a service van is used to deliver a new condensing unit and furnace to a job site? Likewise, some contractors break out advertising by department (and if you can do that with a simple click of a mouse button, it’s a good idea). But don’t drill down so deep that you spend more time digging out the data than the return that mining expedition costs you in terms of time and migraines.
A Sample Printout
Allow me to show you the printout of the Excel spreadsheet you can request from me. It is wide, so I’ll will show it in two parts: The total income data and the gross breakdown into installation and service, and then the breakout for six departments. Here it is:
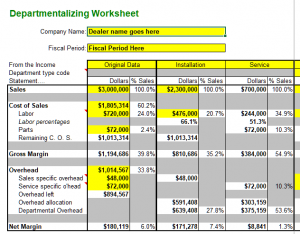
General Breakdown
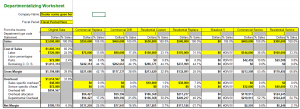
Breakdown of Six Departments
Note the tiny red triangles that appear at the upper right corner of some cells. These red triangles are flags that tell you there is a hint here to help you work the spreadsheet.
First, make entries in any cell with a yellow background.
Granted, the details on the six departments are small and hard to read but let me give you the quick summary.
Note that the general income statement shows $3,000,000 in sales (100%), $1,805,314 in cost of goods sold (60%), $1,194,686 in gross margin (40%), $1,014,567 in overhead (34%) and net profit of $180,119 (6%).
The general breakdown (Installation and Service) shows a sharp difference in the numbers for each department.
And notice how I allocated overhead: I allocated the net overhead to each department based on that department’s labor bill to the total labor for the company. Therefore, since Commercial Replacement’s labor is 14% of the total company’s labor, it gets 14% of the overhead, while Residential Replacement eats up 32% of the company’s labor and thus gets over twice as much overhead charged to it.
The detailed department-by-department breakdown shows that the most profitable department (at 25%!) is Commercial Replacement, while the ugly step-child is Residential Replacement (losing 22%). (And I would bet that the Residential Replacement department is chasing down all those high labor / low material jobs because the owner bids his jobs the wrong way. Doh!)
Applying This to a Job to Bid
Let’s say that this business owner has a job to bid in the Residential Replacement department. The owner used the single factor pricing method (until he read my column from last month). The job’s material load is $7,000 while labor is estimated to come in at (or near) $2,000. Using his old income statement, with a gross margin of 40%, the contractor would divide the total costs ($7,000 + $2,000 = $9,000) by (40% + the profit goal). Let’s say he wants 10% net profit. So his divisor would be 0.50 and his quote would be $18,000.
But now that he knows his internal numbers, he approaches the job with COWL. First, note that the job’s ratio of material to labor is $7,000 / $2,000 = 3.5 to 1. Historically, his ratio is $1,013,314 / $720,000 = 1.41. So this job will make his business stronger.
Using COWL methods, he finds that in the Residential Replacement department, the ratio of overhead to labor is $249,217 / $170,000 = 1.47. So for every dollar of labor, he needs to reserve $1.47 for overhead. So here is how he bids the job:
Material $7,000
Labor $2,000
Overhead $2,932 ($2,000 x 1.47)
TOTAL COSTS $11,932
For 10% profit… $11,932 / 0.90 = $13,258
Wow! That is $4,742 lower than the SF price he would have bid this nice job at. (And had he used SF, he’d be whistling in the dark…)
How to Get the Spreadsheet
To get a copy of the Excel spreadsheet (it should be okay for Excel 2010 and later), send an email to the publisher (llackey@ac-today.com) and he can get hold of me and I’ll email you the spreadsheet. And it won’t cost you a dime (and it may save you hundreds of thousands of dollars…)
Here is to a stunning 2020, Covid19 or not!